How To Use Video Analytics Tools
Video analytics tools give me a new way to understand how viewers interact with my content. Whether I’m creating YouTube tutorials, managing social media ads, or running webinars, these tools offer powerful insights into how people watch, get involved, and respond to videos. Having a smart workflow is pretty important if you want to make the most of your video analytics and actually use the data to improve your content. Here’s my take on using video analytics tools and making sense of the numbers they generate.
Why Video Analytics Matter for Content Creators
Video analytics tools have changed the way I approach content, giving me more than just a view count or a thumbs-up. They help me see things like how long viewers stay, where they pause, and which parts get skipped. This kind of detail tells a way deeper story than just watching numbers rise or fall. The global market for digital video content keeps growing, and with that, analytics tools are packed with new features to help creators, marketers, and business owners reach their goals.
Knowing what works (and what doesn’t) helps me make smarter choices. Maybe a video gets lots of clicks, but everyone drops off halfway through; this sort of data is really valuable. I use it to tweak future content, rethink old ideas, and boost performance across all my channels. If a certain intro style keeps viewers engaged, I’ll stick with it for my next uploads. But if I find that longer videos tank retention, it’s time to try shorter formats to see if that makes a difference.
Video analytics first took off in marketing, but now almost every platform, such as YouTube, Facebook, TikTok, and even internal training software, boasts built-in or compatible analytics. If you’re just starting, having this kind of feedback loop can speed things up for your learning and sharpen your strategy. When you spot trends across platforms, you can make subtle but impactful adjustments—like changing upload schedules or experimenting with interactive elements such as quizzes or polls.
Get Started with Video Analytics Tools
Trying out video analytics doesn’t have to be overwhelming. There are tons of tools out there, from free options like YouTube Analytics to paid solutions such as Wistia, Vidyard, and Vimeo Pro. Each tool has its signature set of dashboards and insights, but all follow similar basics—tracking how real people interact with videos.
For beginners, picking a platform with a straightforward, userfriendly interface is pretty useful. Most start you off with these key video analytics terms:
- Watch Time: Tracks the total time viewers spend watching your videos, not just the number of views.
- Audience Retention: Shows exactly which parts of your video keep people watching or where they click away.
- Engagement: Covers likes, comments, shares, and even interactive features like polls or end screens.
- Play Rate: Measures how many times your video was actually started when shown on a page.
Getting the hang of these basics goes a long way toward helping you understand the story behind your content stats. You’ll be able to draw out what viewers love or what turns them off, and you can steadily improve your approach.
Step-by-Step Guide to Using Video Analytics
Setting up and using video analytics tools is pretty doable, even for those who aren’t tech experts. Here’s how I usually walk through the process:
- Pick a Platform: Decide where you’ll be uploading or embedding your videos. Each major video host has analytics built in, but make sure you actually have access to the dashboard, like needing a YouTube account to use YouTube Analytics.
- Upload Your Content: Post your video and—if you’re using paid tools—set any necessary tracking codes or integrations. Most of the time, it’s a simple copy-paste job that takes about two minutes.
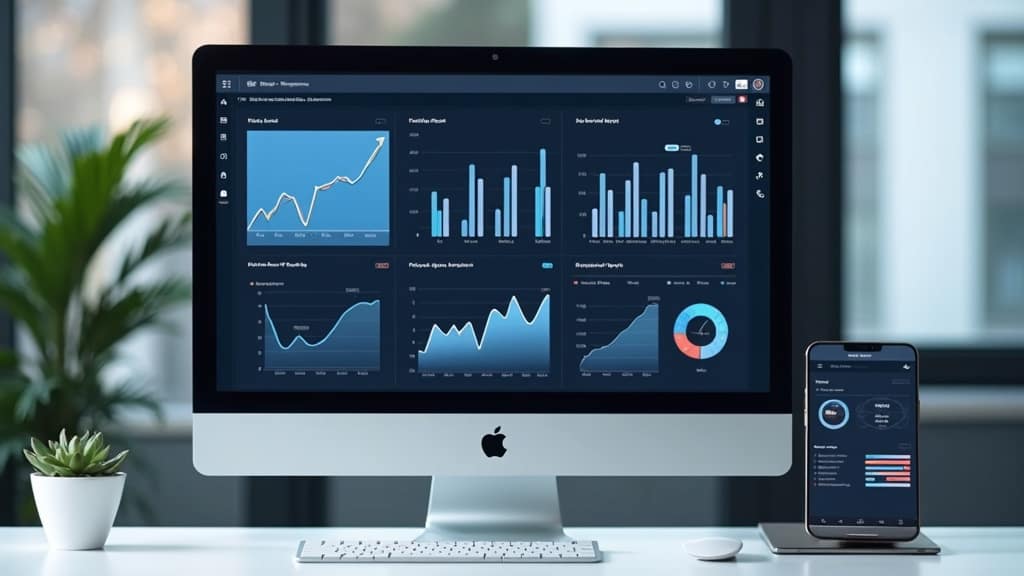
- Get into the Data: Most dashboards show graphs and charts that highlight daily views and engagement. Experiment with filters; sort by video, date range, or audience segment to see what stands out.
- Look for Patterns: Watch for places where people rewind or stop watching. Those spikes and drop-offs are telling you something. Maybe the pacing needs work or the intro was too long.
- Use Insights to Improve: Apply what you learn. Maybe you need shorter videos, punchier titles, or clearer calls to action. I like to test small changes and check whether the analytics move in the right direction.
By repeating these steps for each new video, patterns will start to show, and you’ll get more confident making content decisions backed by real evidence, not just a hunch. You can even set up regular review cycles, so you measure progress over weeks and months—not just video by video.
What to Watch Out For With Video Analytics
Like anything else, analyzing video stats comes with its own little bumps. Here are some things I always keep on my radar to avoid confusion or burnout:
- Information Overload: Dashboards can spit out tons of data points, but not all of it is actually helpful. Focus on metrics that match up with your goals; maybe that’s retention for a how-to channel, or play rate for a landing page video.
- Data Gaps: Analytics tools aren’t perfect. Sometimes, playback is blocked in certain countries, or ad blockers disrupt the data. I don’t panic about small drops, since sometimes the cause is totally outside my control.
- Misinterpreting Results: A sudden dip might mean your content flopped, or it could be that everyone was busy with a holiday or world event. Trends matter more than quick spikes.
- Privacy Rules: New privacy regulations (like GDPR) mean some details, like viewer location or device data, might be limited. Always check your analytics tool’s privacy settings.
Focus on What Matters Most
It’s tempting to chase every number, but I’ve found that sticking to two or three main goals helps me stay on track. For example, a brand may care most about conversion rate, while an entertainer is watching shares and likes. Being clear about the “why” behind the numbers helps prevent overwhelm and gives the whole process some focus. If you’re clear about what your audience and business need, you won’t get lost in the weeds.
Recognize External Factors
It’s also smart to realize your data is influenced by things like platform algorithms, trending topics, or even the time of day you post. I like to test videos at different times, or with different thumbnails, to see if those factors play a role. Seasonality, special events, or shifts in platform policies can throw off your numbers—always keep that in mind before drawing big conclusions.
Pro Tips and Hacks for Smarter Video Analytics
Once I got past the basics, I started picking up tricks to squeeze more value out of my analytics dashboards:
Segment Your Audience: Most tools let you split data to see how certain groups behave, such as age, device, or location. If mobile users drop off early but desktop viewers stick around, I might edit for a snappier mobile cut. Testing content styles with specific audience segments can give you a more targeted approach—which often pays off with stronger engagement rates.
Monitor Real-Time Data: Some platforms, like YouTube, allow you to watch analytics in real time for trending topics or live events. I find this super useful for tweaking titles and thumbnails quickly, especially if you’re competing in a noisy space. Making quick changes can boost watch time in just a few hours.
Set Up A/B Testing: Tools like Vimeo and Vidyard offer splittesting for thumbnails, intros, or calls to action. Testing two versions side by side helps me see what works best; no more guessing. Over time, even small differences in thumbnail choices or video length can add up to a noticeable boost in retention and engagement.
Integrate with Other Tools: Analytics data gets even more useful when combined with info from Google Analytics or social media metrics. Linking platforms gives me a fuller view of how video fits into my whole marketing or educational strategy. This is especially helpful for businesses and creators juggling multiple kinds of content.
These approaches help link up my creative decisions and the audience’s real reactions, leading to smarter and more effective videos. I also like to check out case studies or jump into creator forums to learn how others are getting results from their analytics, which can spark new content ideas or smarter distribution tactics.
Video Analytics Use Cases and Practical Examples
Understanding the numbers is handy, but the real boost comes from seeing how analytics can solve everyday problems. Here’s where I’ve seen video analytics make a big difference:
- Improving Training Videos: By tracking where employees pause or re-watch sections, I can spot confusing parts and update for clarity.
- Refining Social Media Clips: Analyzing which clips have the best retention on Instagram helps me learn what grabs attention and what gets skipped. This feedback is great for sharpening future content.
- Boosting Sales Demos: Watching for viewer drop-off helps me shorten demo videos and get to the benefits faster, making a better impression with leads.
Even small tweaks based on analytics, like choosing better thumbnails or cutting long intros, can raise click rates and boost watch times. The key is to act on what the data tells you, rather than guessing or sticking to habits that might not work.
Other practical use cases include tuning educational webinars by looking at where students lose focus, or upgrading live streams by tracking viewer engagement peaks. In collaborative projects, sharing analytics reports with team members can help everyone stay focused on shared goals and measure success efficiently. The versatility of video analytics means there’s always a chance to make things better—no matter what type of videos you’re working on.
Common Questions About Video Analytics
Here are some things I get asked a lot by folks looking to get more from their video analytics:
Question: What’s the fastest way to see “what’s working” in my videos?
Answer: Spotting high retention (where viewers stick around past the intro) usually means content is working. Focus on those peaks and pattern your next videos around the successful parts. Also, keep an eye on sharp drop-offs; those often tell you what needs to change right away.
Question: Should I only care about high view counts?
Answer: Viewer numbers are helpful, but engagement—likes, shares, or comments—shows actual impact. High views with low engagement typically means the content didn’t hit home, so I look beyond just raw counts. If you want a loyal audience, keep your focus on those deeper engagement metrics.
Question: How often should I check analytics?
Answer: For busy creators, once a week or after every upload keeps the data fresh but not overwhelming. I try not to get obsessed with daily fluctuations; big-picture trends matter more. A regular schedule for checking analytics helps you avoid feeling swamped by minor day-to-day changes.
Let us Wrap Up Using Video Analytics Tools
Video analytics open up a practical way to improve, experiment, and grow an audience. From understanding basic stats like retention and watch time, to testing new ideas with AB tools and real-time dashboards, I’ve found that the more I pay attention to analytics, the better my videos get. If you’re just starting, don’t get overwhelmed by all the charts; keep a few key goals in mind and build from there. Experiment often, and let the data be your guide to smarter, more engaging content every time you hit publish. Over time, you’ll find that keeping an eye out on analytics not only helps your videos get better results, but it also makes the process of content creation more fun and rewarding.
Would you like to.make your own website
and learn how to build and monetize your online presence?
Then you are at the right place.
Join me in this creative learning journey !


